See the corridor the way people will move through it
Grading plans, profiles and cross-sections describe a road or trail in plan and section. Reviewers, clients and the public meet it in motion, at eye level. Where the earthwork, grades and sight lines change along the route is hard to read from drawings alone.
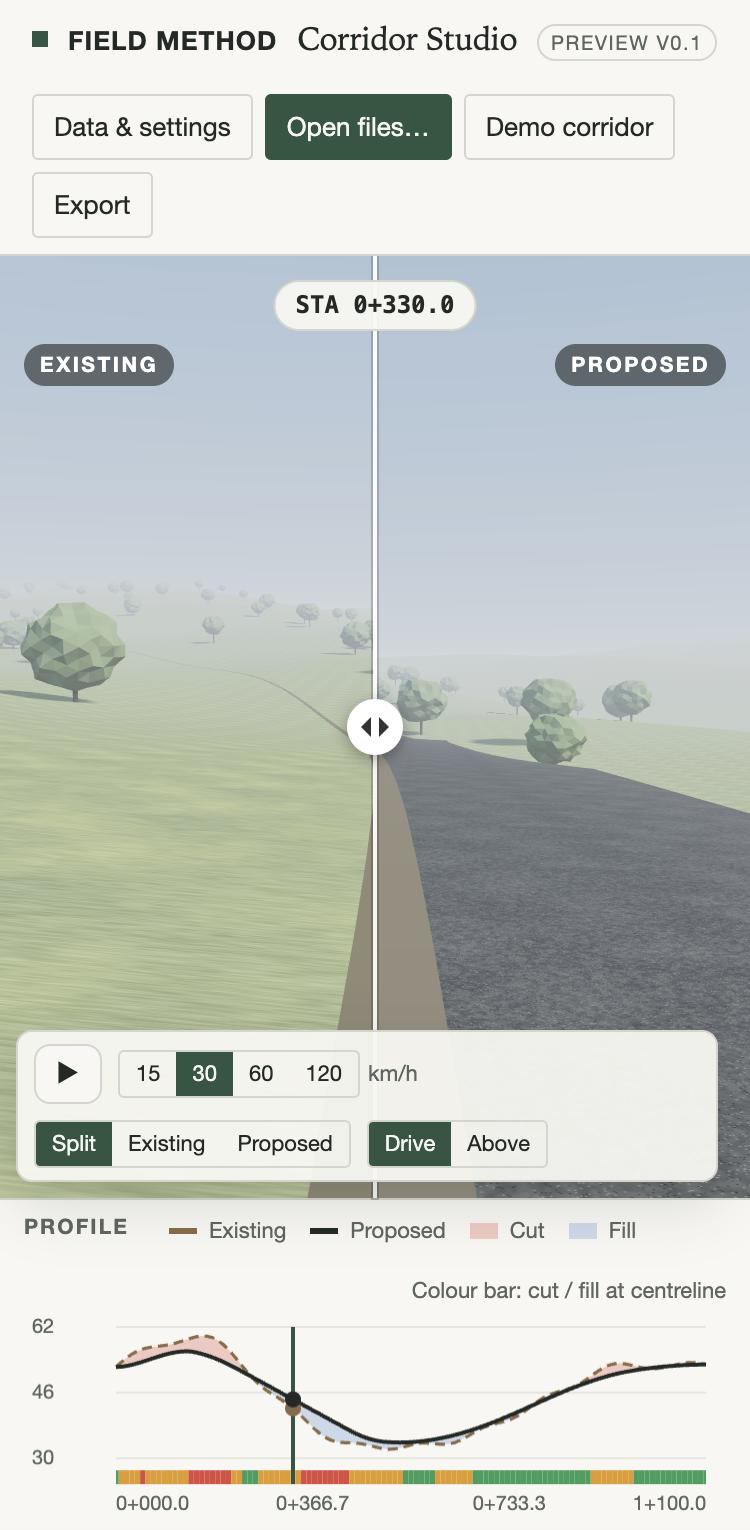
Corridor Studio puts the existing and proposed surfaces side by side along the alignment, so a team can drive the route, stop where something changes, and see the same station in the profile and in a set of measures.
It is for landscape architects, civil engineers, planners and designers working on roads, trails, greenways and other linear corridors at concept and design development.
How it works
- Load your data. Open a LandXML file with the alignment and the existing and proposed surfaces, or load them as separate files. Surfaces are recognised as existing or proposed from their names; you can change the choice.
- Drive the route. Play at a chosen speed, or drag along the profile to any station. Switch between eye height and a view from above.
- Swipe before and after. Drag the divider across the view: existing ground on the left, proposed grading on the right. Or show either surface on its own.
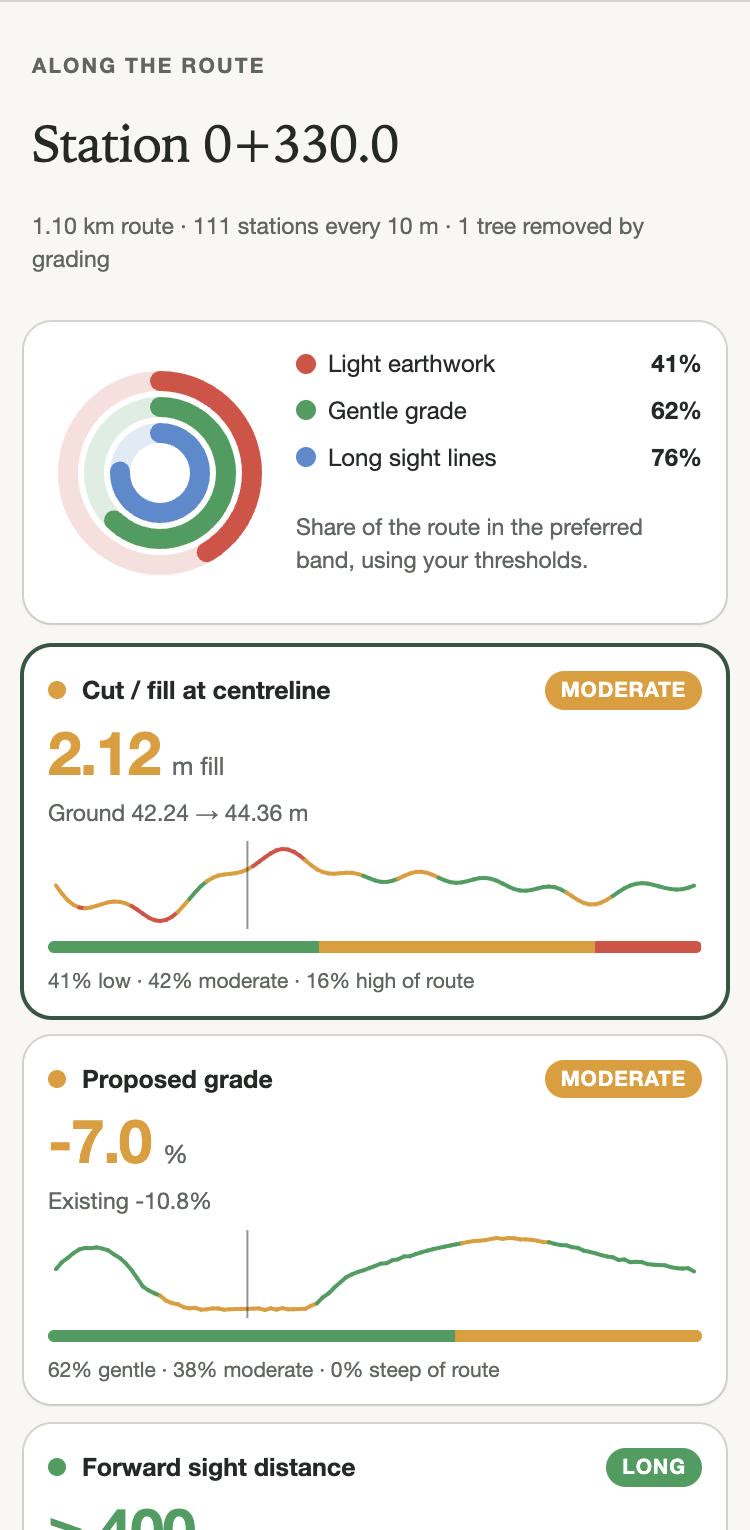
- Read the dashboard. Each measure shows its value at the current station, a colour-coded band, a sparkline along the whole route and the share of the route in each band.
- Export the station table as CSV, or the current view as an image with its station and a preview note.
The measures
- Cut / fill at centreline
- Proposed minus existing elevation on the alignment.
- Proposed grade
- Slope of the proposed surface along the alignment over one station interval.
- Forward sight distance
- How far ahead along the route an object of a set height stays above the terrain line from the viewer’s eye. Where the route or surface ends first, the value is shown as a lower bound.
- View enclosure
- The highest angle from eye level to the ground within a band either side of the route: how much the ground rises beside the viewer.
- Terrain change in view
- Average height change between existing and proposed ground across that band.
Each measure is rated low, moderate or high against two thresholds. The thresholds supplied are example values for exploring a design, not standards. Set them to your project’s criteria. Eye height, object height, station interval and band width are adjustable too.
Supported data
- LandXML 1.x alignments (lines and arcs; spirals are approximated) and TIN surfaces, as exported from civil design software such as Civil 3D, OpenRoads or 12d. Units are read from the file, including US survey feet.
- Alignment as CSV with x and y (or easting and northing) columns, or as a GeoJSON line.
- Surfaces as glTF or GLB meshes.
All files must use the same projected coordinate system, such as State Plane or UTM. Longitude and latitude are not supported. A current browser with WebGL 2 is required: Chrome, Edge, Safari or Firefox.
Limitations
- The measures describe the loaded surfaces only. They are not a design check, a sight-distance compliance review or a visual impact assessment.
- Buildings, vegetation and structures are not obstructions unless they are part of a surface. The demo’s trees are illustrative.
- The view is a real-time rendering for orientation and discussion, not a verified photomontage.
- Large surfaces take longer to load; very large survey surfaces may need simplifying first.
- This is an early preview. Compatibility with every export and browser has not been tested.
Questions
Is it free?
Yes, while it is a preview.
Are my files uploaded?
No. The app is a single web page; it reads your files in your browser and does not send them anywhere.
Where does it come from?
It is part of Field Method’s research into route-based visual assessment: how a corridor changes for the people who move along it. The research continues; the preview is a working tool alongside it.
What next?
Viewpoint photographs at stations, obstructions such as buildings and vegetation, and saved projects are being considered. Tell us what your projects need.
Related: Material Studio · Site-analysis workflow